(changes Oct/2023)
Matlab toolboxes
available here:
M_Map - mapping toolbox -
Version 1.4 now available.
T_Tide - classical harmonic analysis
with error estimates.
LIM - limnological conductivities,
salinities, and densities.
AIR_SEA - air-sea heat flux estimates
from standard observations
RDADCP - Reads RDI (now Teledyne RDI) binary
and processed Acoustic Doppler Current Profiler
files
RDDTX - Reads the .dt4 binaries
produces by
a BIOSONICS DTX digital
echosounder (single beam, single tranducer systems
only - not split or dual-beam systems).
CTD_RD- Reads Seabird
Electronics CTD .cnv files.
Extcontour (obsolete) -
extended contouring capabilities for matlab v4.
OCEANS (obsolete) - once handy oceanography stuff
Other people's useful Matlab stuff
SEAMAT - Matlab for
oceanographers: A central index and database for Matlab tools
useful to oceanographers.
- M_Map
home page
M_Map is a collection of routines that allow you to draw
publication-quality maps in 18 different projections. M_Map includes a
simple coastline and elevation database, and allows you to add your own
data to those maps.
Requires Matlab version 5 (or higher).
Now available for downloading - version 1.4o
(released Oct 2023),
as tar or zip file (if
you are unpacking the zip, REMEMBER TO UNZIP SUBDIRECTORIES AS WELL -
this is by far
the most common problem people have).

- T_Tide Harmonic
Analysis Toolbox
One widely-used program for performing harmonic analysis of
oceanic
tides is the FORTRAN 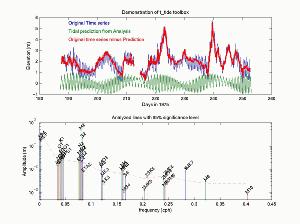 package
created by Mike Foreman (IOS), available at http://www.pac.dfo-mpo.gc.ca/sci/osap/projects/tidpack/tidpack_e.htm.
However, the code is old, and difficult to understand and modify.
Together with Steve Lentz and Bob Beardsley, I have rewritten that
package in
MATLAB, incorporating many useful extras. Currently the code is
apparently
trustworthy for performing a complete analysis. Confidence
intervals
for the analysis can also be calculated.
package
created by Mike Foreman (IOS), available at http://www.pac.dfo-mpo.gc.ca/sci/osap/projects/tidpack/tidpack_e.htm.
However, the code is old, and difficult to understand and modify.
Together with Steve Lentz and Bob Beardsley, I have rewritten that
package in
MATLAB, incorporating many useful extras. Currently the code is
apparently
trustworthy for performing a complete analysis. Confidence
intervals
for the analysis can also be calculated.
(1 Dec 2001) a new function "t_xtide" now provides tidal
predictions in matlab for many stations worldwide using the XTIDE database!!
(Oct 2002) T_tide described in:
- R. Pawlowicz, B. Beardsley, and S. Lentz, "Classical tidal
harmonic analysis including error estimates in MATLAB using T_TIDE",
Computers and Geosciences 28 (2002), 929-937.
Please cite this article if you find T_Tide useful!
The original version of the package (1/Dec/2001) is available as a
zip file here: https://www.eoas.ubc.ca/~rich/t_tide/t_tide_v1.1.zip
Enjoy!
A newer version
(Jan/2003) is available as a zip file here: https://www.eoas.ubc.ca/~rich/t_tide/t_tide_v1.2beta.zip.
This includes a way of handling time series with many points (e.g.
every minute for a year) without running out of memory, and a really
preliminary attempt at analyzing 18.6+ year time series (which is
really not right, so don't use it for this purpose!). Note: the recommended way of handling time
series longer than one year but less than 18.6 years in length is to do
it in one-year chunks - do not just suck in a 3 year time series.
(Feb/2007) An experimental version of T_Tide
that includes support for robust rather than the usual least-squares fitting is available from
David Jay and Keith
Leffler (who spend far more time thinking about tides than I do, these days). Their
modifications
will be incorporated into the current version at some point.
(Mar/2011) I've modified v1.2b by changing finite to isfinite
and call to obsolet signal processing toolbox functions psd and csd
to the newer functions pwelch and cpsd , which stops a list of annoying warnings.
This newer version is available as a zip file here: https://www.eoas.ubc.ca/~rich/t_tide/t_tide_v1.3beta.zip.
This includes a way of handling time series with many points (e.g.
every minute for a year) without running out of memory, and a really
preliminary attempt at analyzing 18.6+ year time series (which is
really not right, so don't use it for this purpose!). Note: the recommended way of handling time
series longer than one year but less than 18.6 years in length is to do
it in one-year chunks - do not just suck in a 3 year time series.
WARNING: the recommended way of handling time
series longer than one year but less than 18.6 years in length is to do
it in one-year chunks - do not just suck in a 3 year time series.
(2014) If you want to do something that stretches the bounds of T_Tide, why not try Dan Codiga's UTIDE, which builds on T_TIDE by incorporating some of the things mentioned above.
(2019) I've modified v1.3b by running it through the matlab editor and fixing a lot of the suggestions (removing semicolons after
end, etc.), removing the
call to a (nonexistent) t_get18consts, and changing the plotting in t_demo and t_equilib so that colours match between legends and lines (since MATLAB changed
the default color order some of these no longer matched). The latest version is available here:
https://www.eoas.ubc.ca/~rich/t_tide/t_tide_v1.4beta.zip.
 (2022) As per the suggestion of R. Ray (see his note in the Journal "Ocean Science" at https://doi.org/10.5194/os-18-1073-2022) I have renamed the annual sidebars to M2 from
H1/H2 to ALP2/BET2 (Alpha_2/Beta_2) for consistency with current naming standards. The latest version is available here:
https://www.eoas.ubc.ca/~rich/t_tide/t_tide_v1.5beta.zip.
(2022) As per the suggestion of R. Ray (see his note in the Journal "Ocean Science" at https://doi.org/10.5194/os-18-1073-2022) I have renamed the annual sidebars to M2 from
H1/H2 to ALP2/BET2 (Alpha_2/Beta_2) for consistency with current naming standards. The latest version is available here:
https://www.eoas.ubc.ca/~rich/t_tide/t_tide_v1.5beta.zip.
- LIM Toolbox
Are you a limnologist? Do you want to compute the conductivity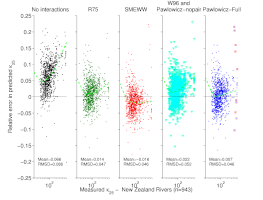 of lake water (or seawater at salinities less than about 4) from its
chemical composition? Do you want to compute
lake salinity from conductivity (to get density?). Then THIS is the
toolbox for you! Contents are:
of lake water (or seawater at salinities less than about 4) from its
chemical composition? Do you want to compute
lake salinity from conductivity (to get density?). Then THIS is the
toolbox for you! Contents are:
- limcond.m - conductivity, specific conductivity,
and salinity using my all-new algorithm that outperforms the following:
- limcondw.m - same using algorithm of Wuest et al. (1996)
- limSMEWW.m - same using algorithms of Standard Methods for the
Examination of Water and Waste Water (American Public Health
Association, 1998 and earlier)
- limR75 - same using Rossum (1975)
- limk25.m - standard composition-independent reference conductivity
- limexample.m - examples file
- limstate.m - limnological equation of state (Chen and Millero, 1986)
- limsal - convert g/l salinity from limcond to g/kg salinity
using limstate
- limPESC.m - converts from mg/l to molar concentrations
- limcarbonate.m - carbonate chemistry: converts from
alkalinity/ph to ionic concentrations
- limconsts.m - utility function with useful constants.
...and Pawlowicz (2008), Calculating the conductivity of
natural waters, Limnology and Oceanography:Methods, 6:489-501 describes what is being done.
- Air-Sea Toolbox
v1.1
This is an updated version of the air-sea interaction toolbox
originally developed by Bob Beardsley et al. (available through the SEAMAT page). This
toolbox is useful if you want to compute the fluxes of heat and stress
across the oceans surface (and assorted related things) from standard
measurements of temperature, wind, etc. The update (v1.1) available here as
a tar-file (or here
as a gzipped tar file ) contains many additions and enhancements
to the original code.
The air-sea toolbox has been upgraded to v2.0 and is no
longer distributed here - go to the SEAMAT page to get the
new version!
- RDADCP
Although the RDI binary and P-file formats are compact and efficient
for storing data, it would be handy to be able to read that data into
MATLAB. There are various
existing toolboxes that purport to do this, but I have found that
they are a) much too complicated for what I want (requiring
netcdf, etc.), b) or
they don't work, or c) both. One reason why these programs often don't
work
is because RDI is constantly changing (improving? evolving?) the format of their
files as new instruments and instrument firmwares are developed. over
time I have been keeping track of these changes....so...presenting:
RDADCP_Oct23v0.zip
- Two functions (rdpadcp.m and rdradcp.m) designed to read RDI
binaries!
Also included is a demo script (adcpdemo) so you can see how it
works.
These functions have been tested on datafiles from many different instruments, with various firmware and software
versions, and with consultation from RDI. However, I know that
YOUR instrument
is some weird custom job that will immediately break it...if so please
let me know. If it works fine...I'd appreciate knowing about it as
well.
Changes:
Nov/2003 - added support for navigation data in VMDAS and WINRIVER
r-files.
Aug/2004 - Some handling of junk data at beginning and end of file
(apparently required for moored ADCPS using several flash cards)
Sep/2005 - If your data was very, very, very noisy then the default
median
cleaning could bias results slightly negative due to a bug. This is now
fixed.
Dec/2005 - better handling of corrupted data blocks.
Mar/2006 - OS/OO and WH-navigators now handled.
Oct/2006 - WINRIVER R-file handling fixed.
Mar/2010 - a lot of minor updates.
Jun/2017 - WINRIVER II, VMDAS, Sentinel V-series, some bug fixes...
Jan/2018 - newer VMDAS
Sep/2021 - Sentinel V firmware 66 support
Oct/2023 - Pioneer DVL Support added
2015 - - These
ADCP Processing Tools with a GUI written by Marius Becker were announced Sep 2007, but no longer seem to be available.
- RDDTX
BIOSONICS now has a nice digital echosounder that writes
files in a binary format "for later use". This binary format has files
ending in '.dt4'. If you want to read this stuff into matlab, use RDDTX.m (note - currently it only works for a
single
beam, single transducer system - NOT dual or split-beam systems).
- CTD_RD
Seabird CTD processing software creates a nice self-describing
data file in which the various header lines describe the contents. ctd_rd.m can read this format to produce a
data structure containing the profile data, with field names taken from
the column labels.
- OCEANS toolbox
A collection of routines useful for oceanographers, including the
UNESCO routines (specific heat capacity, the equation of state, etc.),
various sound-speed equations, T/S diagrams, distances on an
ellipsoidal
earth, and more.
As of 2010, I would heartily recommend going somewhere instead of using this old, obsolete, and
superceded toolbox.
For equation of state and thermodynamics stuff, go to the TEOS-10 website.
Ellipsoidal distance are best handled by an algorithm in M_Map .
- Extcontour
Extended contouring capabilities for Matlab. Can handle parametric
surfaces, filled contours, publication-quality labelling and more.
- Original
version , intended for v4.2. No longer really supported, but if
you find a bug let me know and I will still try to help you!
- Original version of extcontour, with the minimal modifications
necessary to make it run under Matlab5.0 (click on either the gzipped tar-file or
the .zip archive ).
I DO NOT RECOMMEND USING THIS FOR ANYTHING OTHER THAN V4 PROGRAMS YOU
NEED TO GET RUNNING UNDER V5. For future use, the code of option 3 is a
better choice.
- Most of the code from the original version is incorporated
into matlab v5.0. However, there are a few bugs in the 5.0
implementation
of contourf.m, contours.m, and clabel.m.
Also, all capability to change font name/size/colour/rotation and label
spacing was also left out of the 5.0 implementation of clabel.m.
Updated and corrected versions of these m-files are available here
(click on either the gzipped tar-file or
the .zip archive ).
These files should be placed in $MATLAB/toolbox/matlab/specgraph/.
As of v5.2 contourf.m and contours.m are
satisfactory. However, clabel.m is still missing a few things
which should
(hopefully) be available in 5.3, when that comes out. A version of clabel.m
for 5.2 that allows for such things as changing the font size and label
spacing is available here
.
By v5.3 you don't need to come here any more!
Last changed 30/OCt/2023. Questions and comments to Rich Pawlowicz ,
mailto:rich@eos.ubc.ca
 package
created by Mike Foreman (IOS), available at http://www.pac.dfo-mpo.gc.ca/sci/osap/projects/tidpack/tidpack_e.htm.
However, the code is old, and difficult to understand and modify.
Together with Steve Lentz and Bob Beardsley, I have rewritten that
package in
MATLAB, incorporating many useful extras. Currently the code is
apparently
trustworthy for performing a complete analysis. Confidence
intervals
for the analysis can also be calculated.
package
created by Mike Foreman (IOS), available at http://www.pac.dfo-mpo.gc.ca/sci/osap/projects/tidpack/tidpack_e.htm.
However, the code is old, and difficult to understand and modify.
Together with Steve Lentz and Bob Beardsley, I have rewritten that
package in
MATLAB, incorporating many useful extras. Currently the code is
apparently
trustworthy for performing a complete analysis. Confidence
intervals
for the analysis can also be calculated.  of lake water (or seawater at salinities less than about 4) from its
chemical composition? Do you want to compute
lake salinity from conductivity (to get density?). Then THIS is the
toolbox for you! Contents are:
of lake water (or seawater at salinities less than about 4) from its
chemical composition? Do you want to compute
lake salinity from conductivity (to get density?). Then THIS is the
toolbox for you! Contents are: